6
Critical Domains
Infrastructure, artificial intelligence, space exploration, renewable energy, scientific research and defense technology.
Where the United States stands, where it falls behind, and the bold technological leaps needed to lead the next century of human innovation.
Infrastructure, artificial intelligence, space exploration, renewable energy, scientific research and defense technology.
Infrastructure, renewable energy and fundamental scientific research show negative score gaps against the leading competitor benchmark.
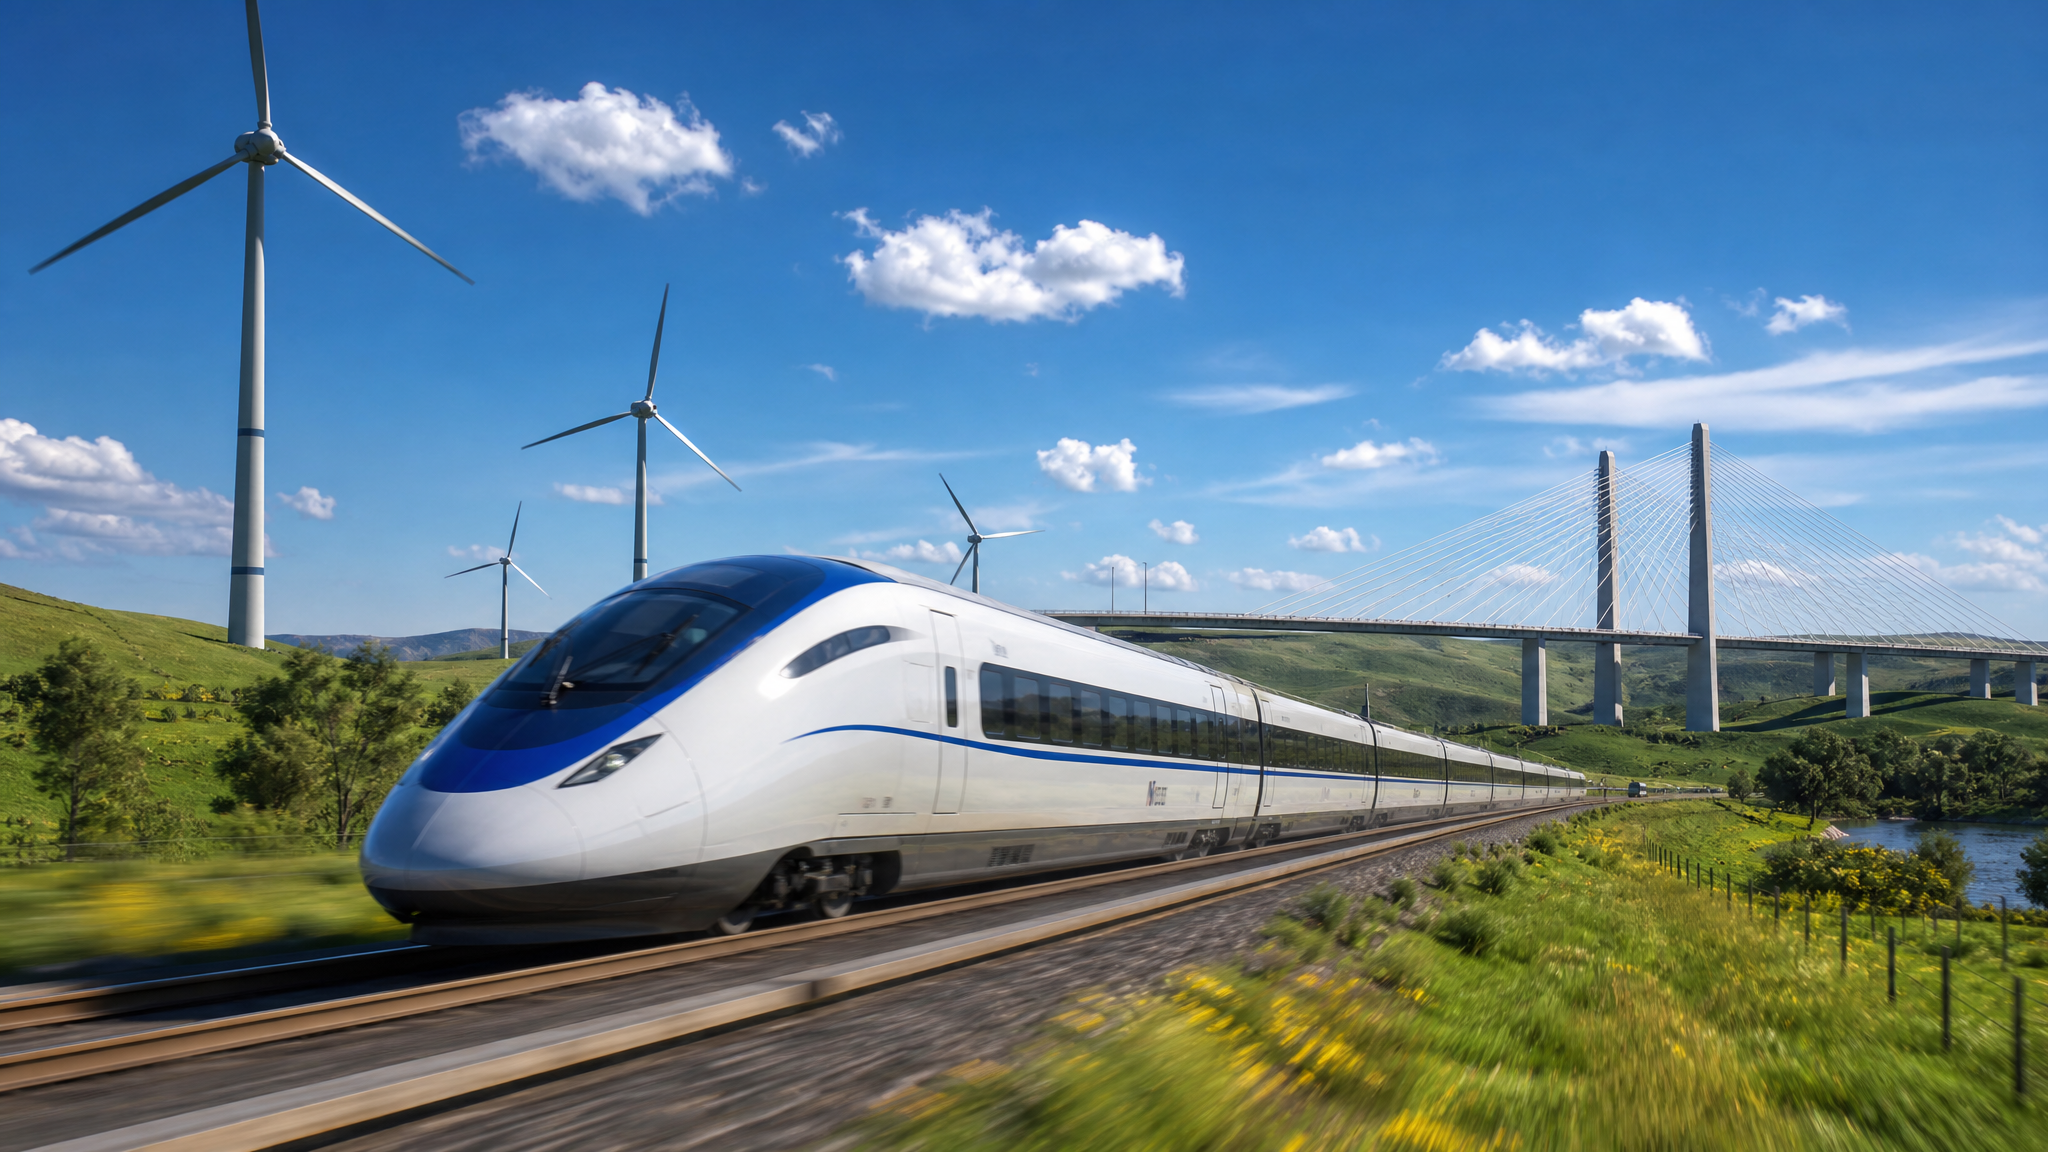
China has the world's largest high-speed rail network, while the United States has 0 km of true high-speed rail.
A comparative analysis of US technological readiness versus leading competitors across six critical domains. The United States still has the deepest innovation ecosystem in the world, but the answer is not complacency or panic. It is national renewal: build faster, train more engineers, modernize the grid, fund science and deploy technology at the speed of the century already underway.
Building the Backbone of Tomorrow - US score 55/100 versus China 88/100.
ASCE 2025 Report Card
vs. 0 km true US HSR
of US lines over 25 years old
in poor or mediocre condition
The contrast is stark: China has built the world's largest high-speed rail network at 48,000 km and counting, while the United States has zero kilometers of true high-speed rail. America's infrastructure earned a C grade from the ASCE in 2025, with roads at D+ and energy at D+.
Roughly 70% of US transmission lines and transformers are over 25 years old. Large power transformer lead times have stretched to 36-60 months. About 39% of major US roads are in poor or mediocre condition, and 6.8% of the nation's 623,000 bridges need urgent attention.
The path forward demands long-duration infrastructure planning, faster permitting, stronger domestic manufacturing for grid hardware, and real HSR corridors that can compete with air travel on dense routes. The funding momentum exists - the challenge is converting dollars into built infrastructure at the speed demand requires.
The US has funding momentum but operates on yesterday's capacity while tomorrow's demand from AI, electrification, and data centers is already arriving.
The Race for Cognitive Supremacy - US score 78/100 versus China 75/100.

23x more than China in 2025
between top US and China models
drop in researchers moving to US since 2017
Publications, patents, robot installations
The US remains the global leader in frontier AI, but the gap is closing fast. The 2026 Stanford AI Index reveals the US-China model performance gap has effectively closed to just 2.7%. While the US still leads in top-tier model production and private investment at $285.9 billion, China dominates in research volume, citations, patent output, and industrial robot installations.
Perhaps most alarming: the number of AI researchers and developers moving to the US has fallen 89% since 2017. China benefits from national industrial scale, coordinated state planning, and massive compute infrastructure investment.
The US must convert its frontier-model advantage into a deployment advantage. That means more compute access, better immigration and talent retention policies, tighter links between research labs and manufacturing, and faster AI adoption across healthcare, logistics, defense, and public services.
The US leads in investment but China leads in scale. The countries that pair models with industrial execution will own the next decade.
The New Frontier Competition - US score 82/100 versus China 72/100.
April 1, 2026 - crewed lunar flyby
Permanently crewed space station
First-ever far side lunar return
of launch service contracts
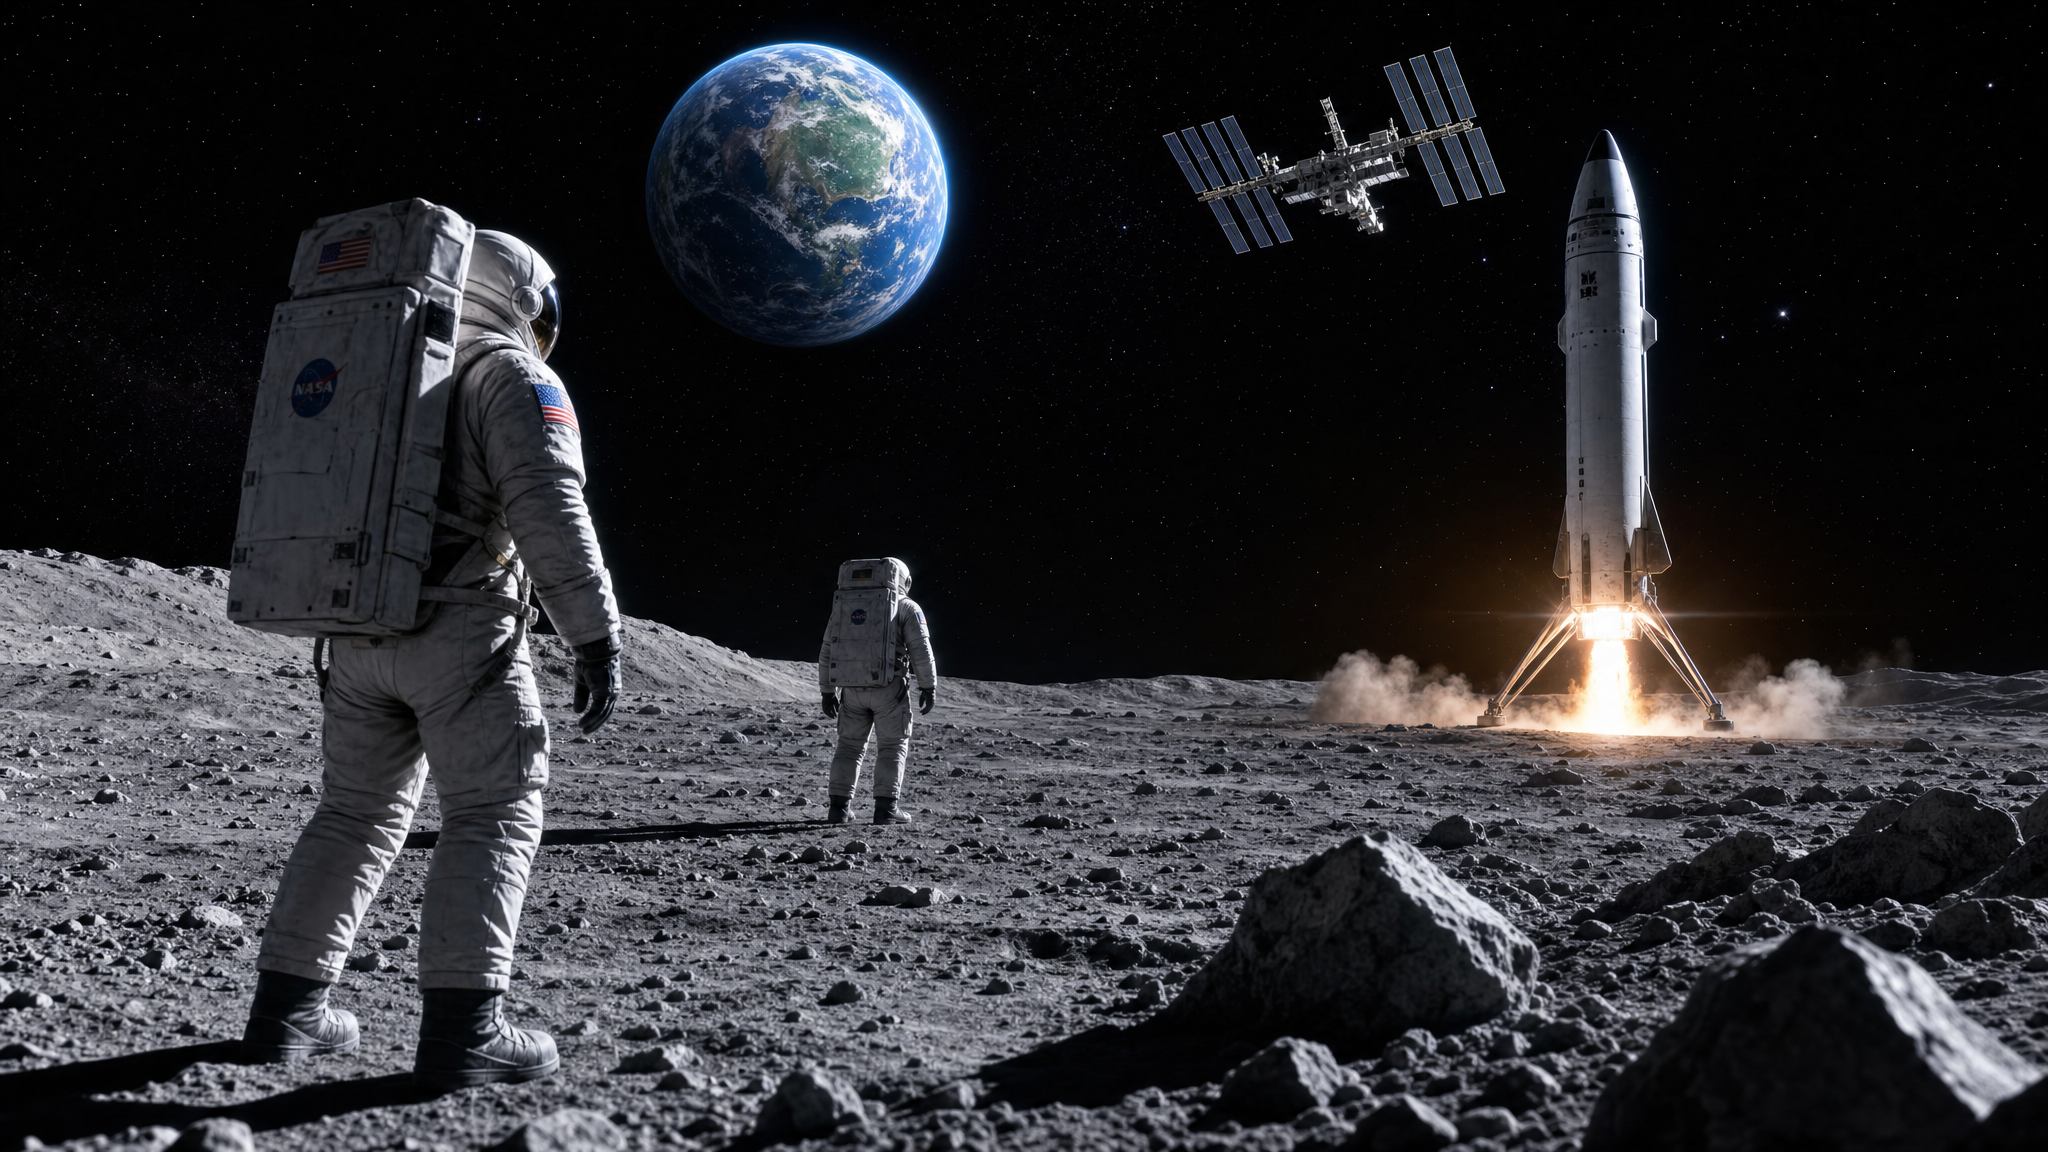
Space is where ambition meets cadence. The US has the strongest commercial launch ecosystem, but China has built a steady, state-backed lunar and orbital tempo that demands respect. Artemis II launched on April 1, 2026, but the program has faced repeated delays, with Artemis III pushed to 2027.
Meanwhile, China's Tiangong station is fully operational and permanently crewed. In June 2024, Chang'e-6 returned 1,935.3 grams of lunar samples from the far side of the Moon - a historic first. Russia's civil space program, once dominant, has lost about 90% of its launch service contracts.
The US needs steadier funding, faster hardware maturation, and fewer mission resets. It should treat lunar infrastructure the way China treats orbital infrastructure: as a long game with annual cadence, not an occasional spectacle. The real competition is not about planting flags - it is about who owns the infrastructure layer of cislunar space.
The US has the larger commercial ecosystem, but China has faster state-driven mission cadence and a functioning orbital lab with continuous crews.
Powering the Clean Revolution - US score 45/100 versus China 92/100.
in 2024 alone
global manufacturing dominance
substantial but trailing
plasma sustained at 70 million C
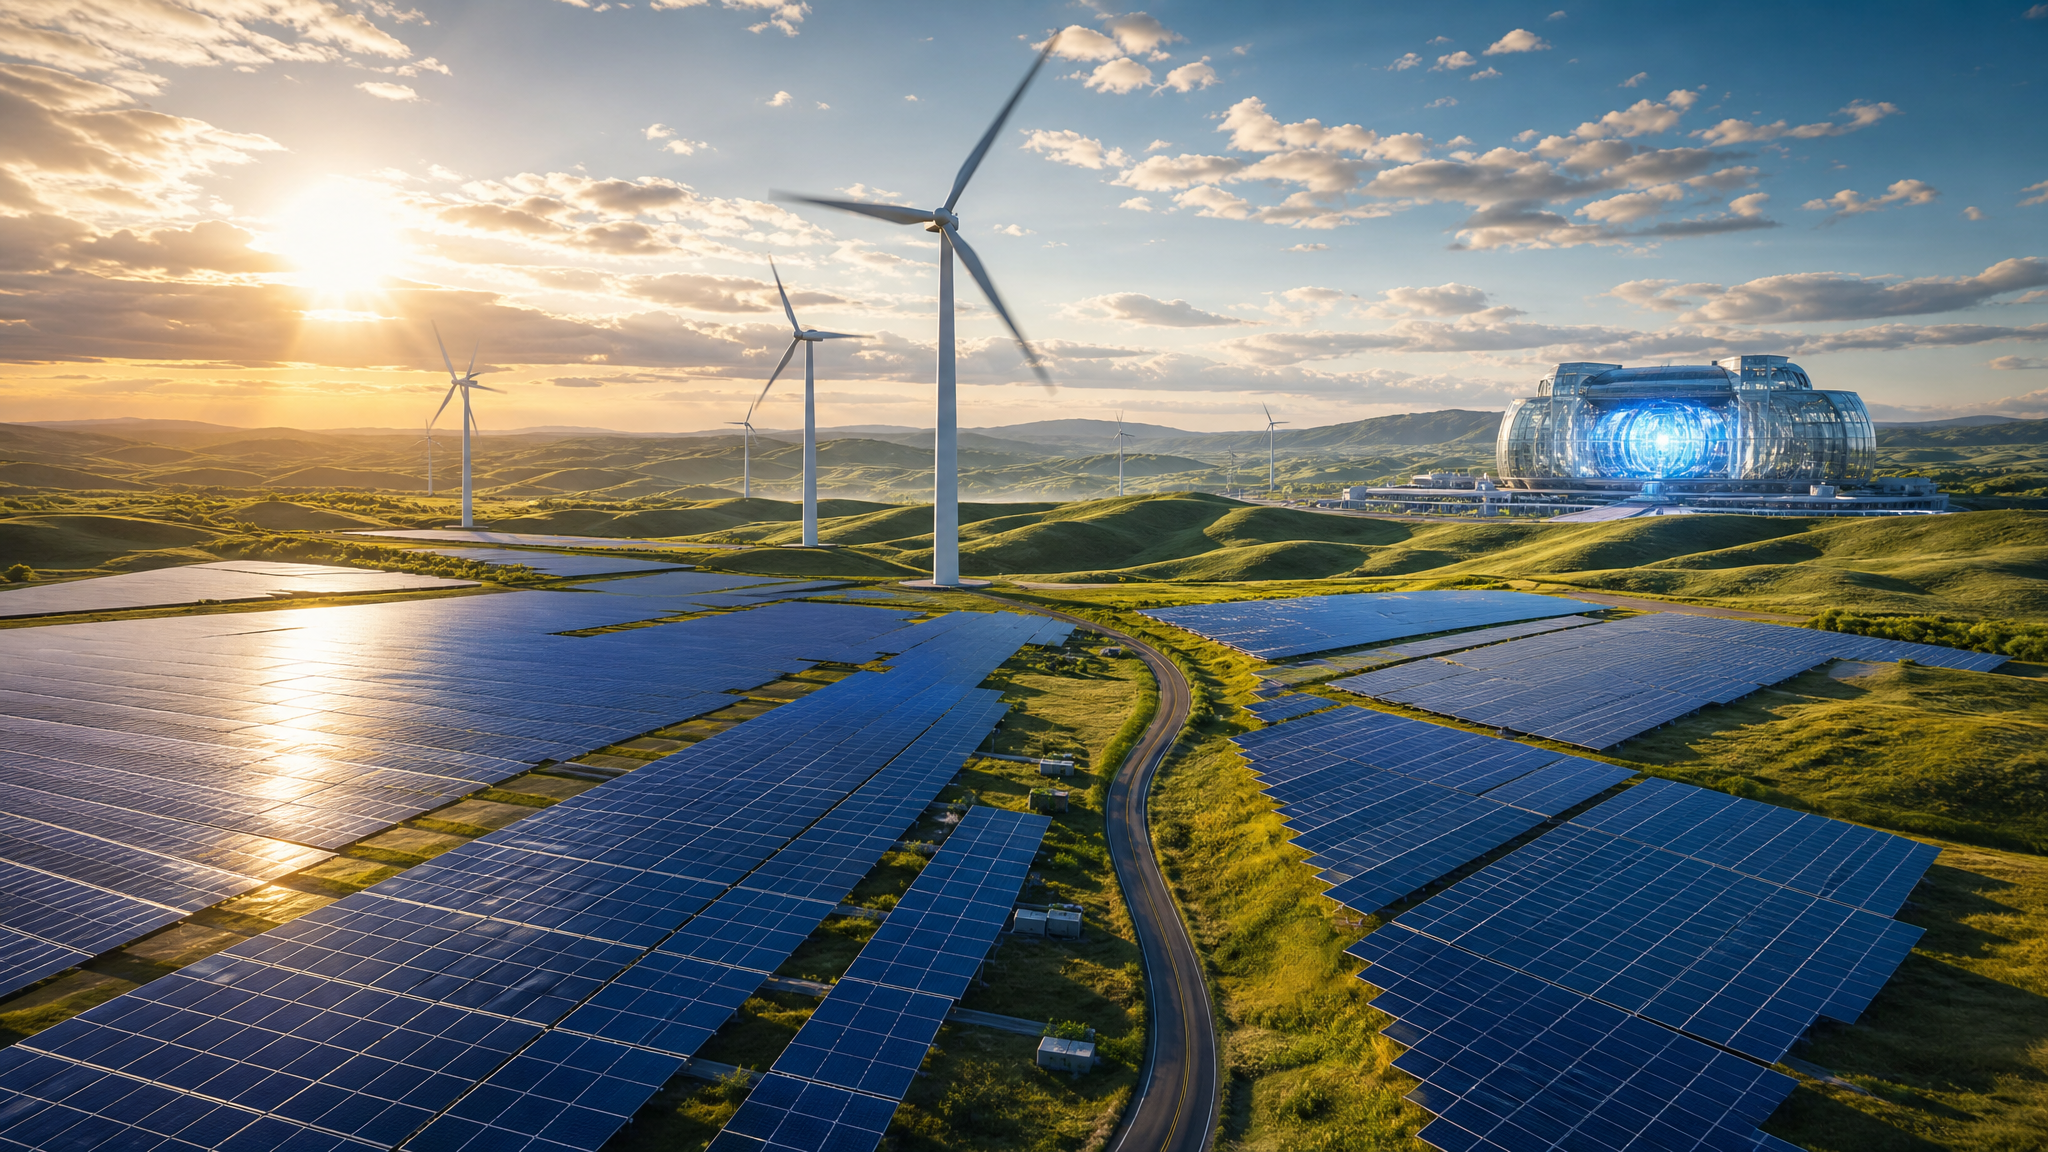
This is one of the starkest industrial gaps. China does not just lead in renewable energy - it owns the manufacturing base. The IEA reports China's share of key solar manufacturing stages exceeds 80%, producing 98% of solar wafers, 92% of solar cells, and 85% of solar panels globally.
China invested over $625 billion in clean energy in 2024 and reached its 2030 wind and solar targets six years early. It added 79.3 GW of wind capacity, bringing total wind capacity to 521 GW. The US invested $272 billion and added 33 GW of solar and wind - substantial, but not at the same scale.
In fusion research, China's EAST tokamak sustained plasma for 1,066 seconds at 70 million C in 2025. The US must rebuild domestic manufacturing for solar, batteries, inverters, and grid equipment. Clean energy is not just a generation challenge - it is a supply chain and infrastructure challenge that demands industrial-scale thinking.
China's clean-energy machine is now so large it no longer looks like a transition. It looks like an industrial system.
The Foundation of Future Power - US score 70/100 versus China 78/100.
surpassed US in 2024
China vs 12% US share
of US S&E doctorates
vs 45,000 US S&E doctorates
The US still produces some of the best science in the world, but China has surpassed it in scale. The NSF's latest indicators show China estimated to have surpassed the US as the largest performer of R&D in 2024, spending $1.028 trillion versus America's $1.009 trillion.
In global S&E publications, China accounts for 31% versus the US's 12%. Temporary visa holders earn 38% of US S&E doctorates, including 61% in computer science and 54% in engineering - a strength that becomes a vulnerability if talent leaves. US student performance in math and science has slipped from pre-pandemic levels.
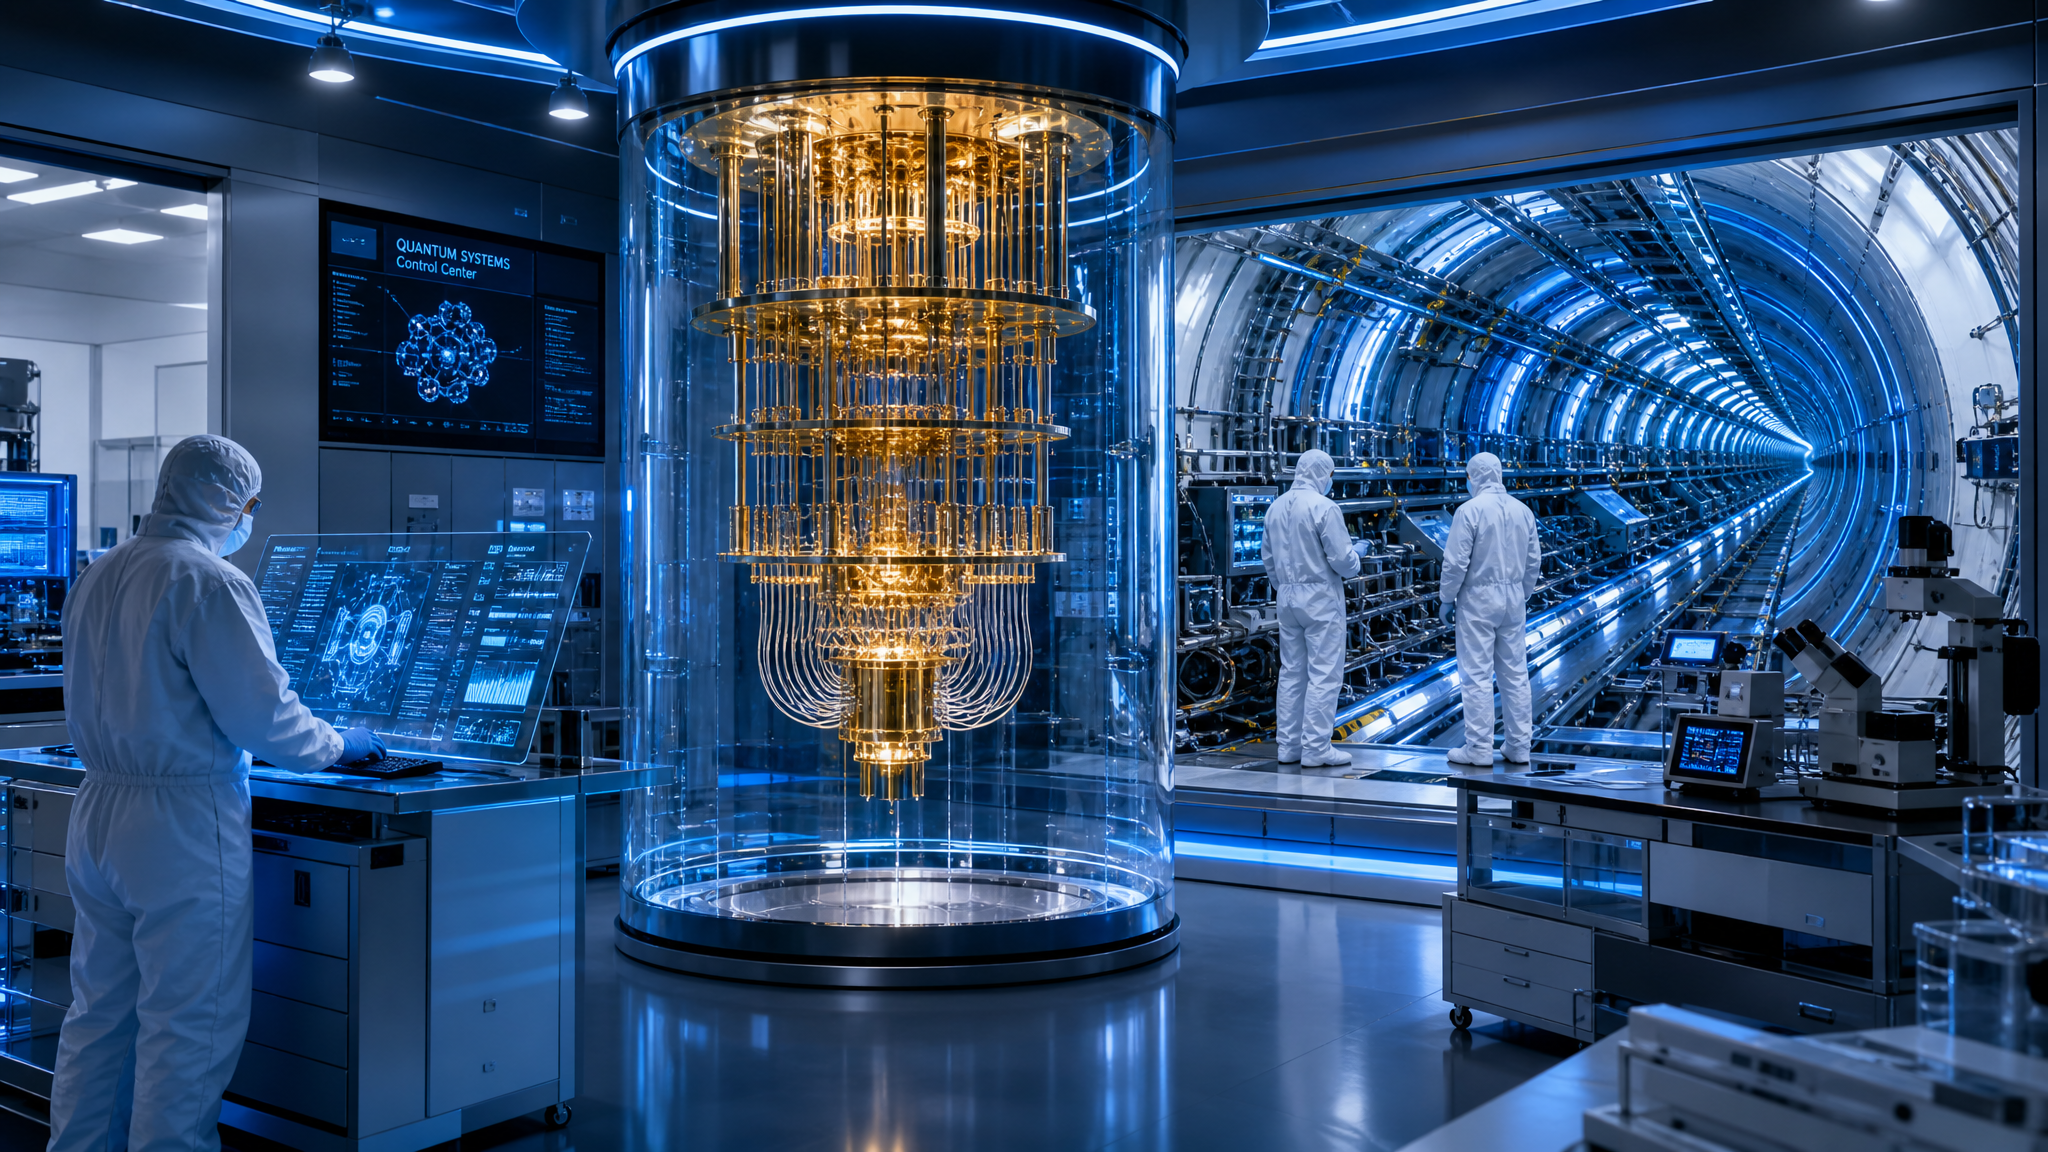
The US participates in CERN's particle physics ecosystem without owning a comparable domestic facility. Quantum computing remains fiercely contested, with both nations racing toward practical quantum advantage. The challenge is scale, continuity, and the ability to keep talent on shore through stronger basic research funding and better STEM preparation.
The US still creates world-class science. The challenge is scale, continuity, and keeping talent onshore.
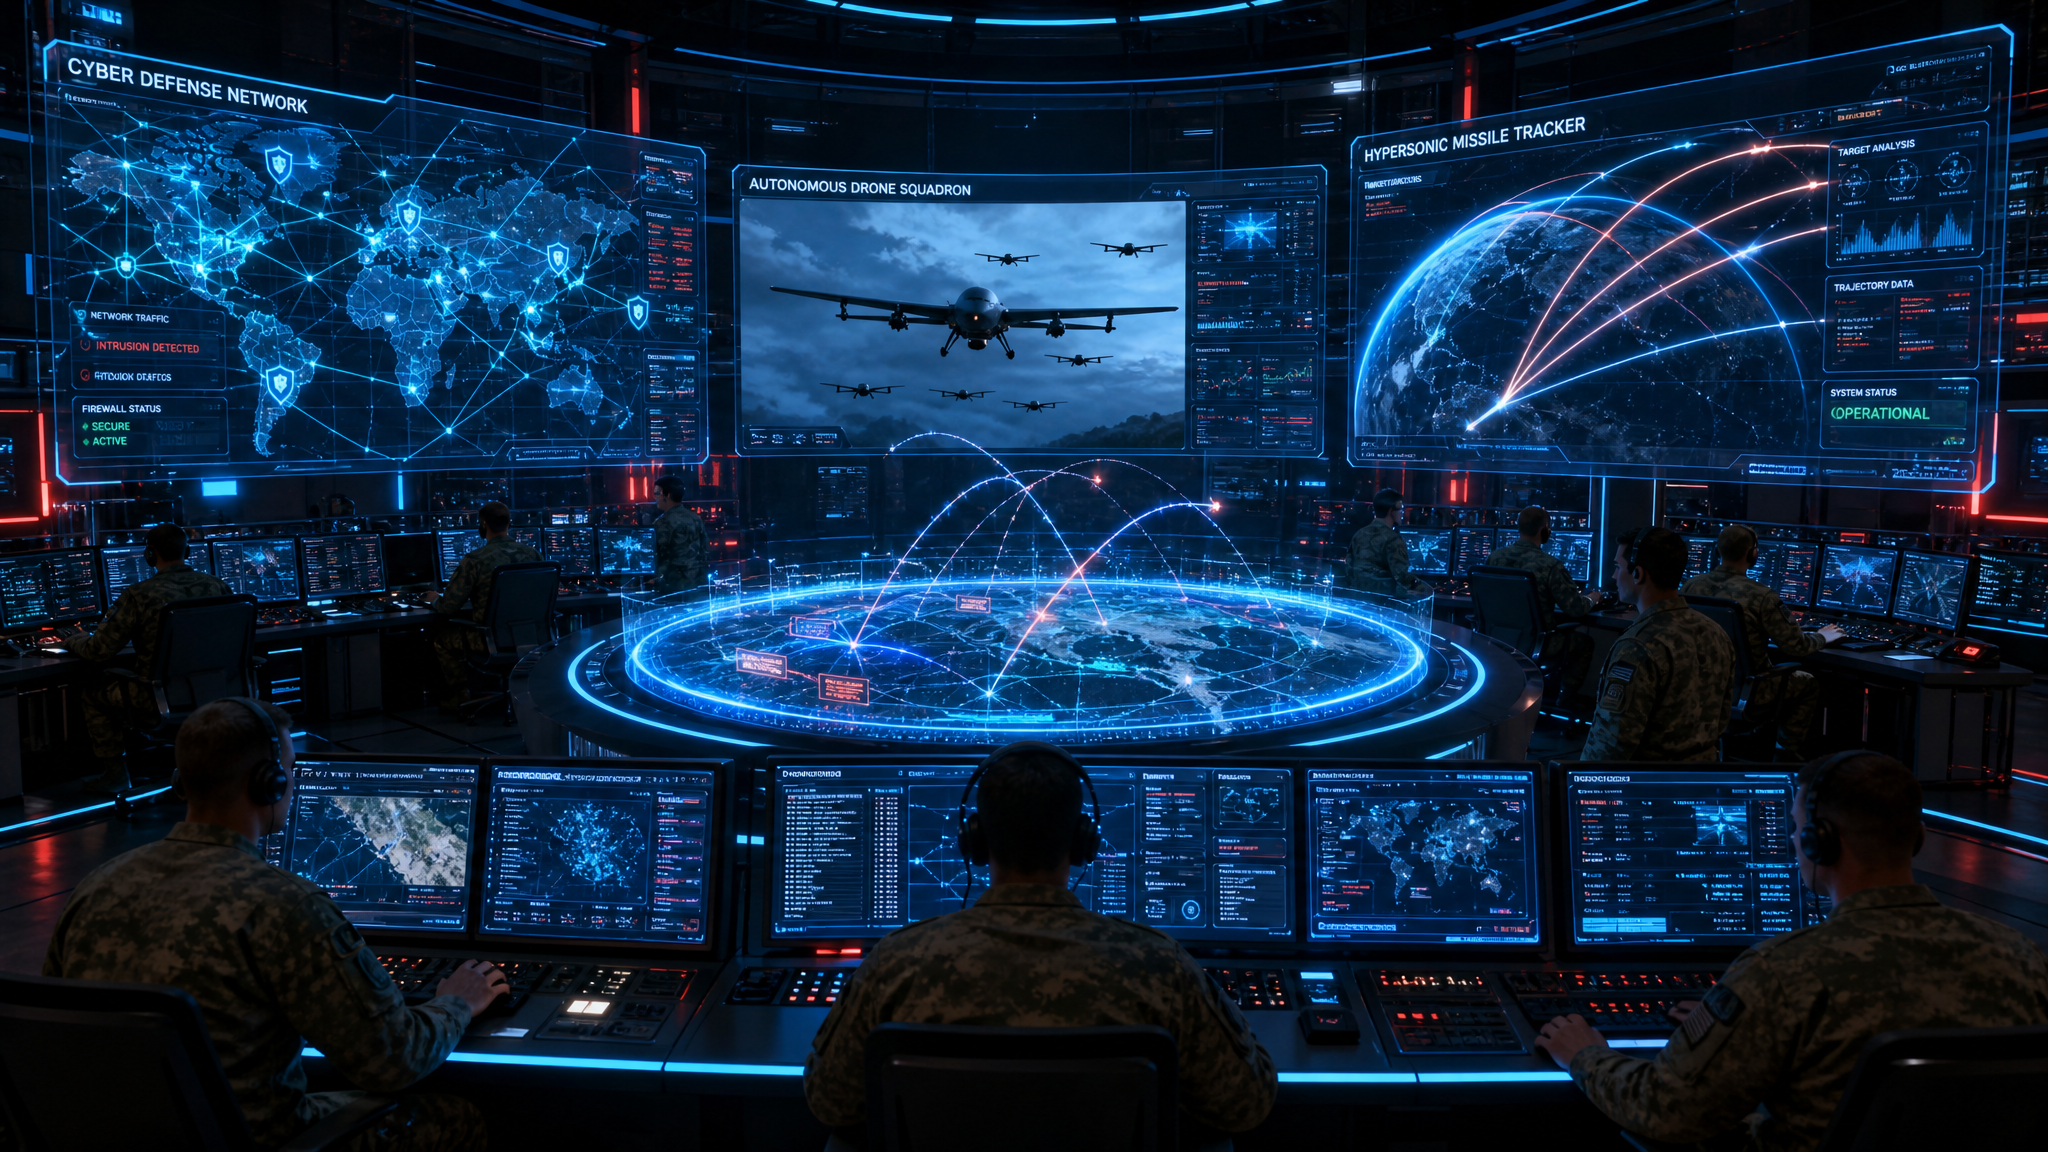
Securing the Future Battlespace - US score 85/100 versus China/Russia 70/100.
down from $6.9B in FY2025
global commercial drone dominance
maintained in US networks
Avangard and Kinzhal deployed
The US remains the world's most capable military power overall, but the gap is narrowing in domains that matter most in high-intensity conflict: hypersonics, cyber operations, autonomous systems, and drone warfare.
Russia has operational hypersonic systems like Avangard and Kinzhal; China fields the DF-17/DF-ZF. The US is still focused on prototypes rather than broad operational deployment. In cyberspace, CISA reports that PRC actors have maintained footholds in US critical infrastructure networks for as long as five years.
DJI holds roughly 70-80% of the global commercial drone market, giving China a massive hardware ecosystem advantage. The Pentagon's Replicator initiative acknowledges a critical truth: the US cannot outbuild China one expensive platform at a time. It must outproduce, outnetwork, and outadapt. The next conflict will reward industrial speed, not just exquisite technology.
The US cannot outbuild adversaries one expensive platform at a time. It must outproduce, outnetwork, and outadapt.
The United States still has the deepest innovation ecosystem in the world. The answer is not panic - it is national renewal: build faster, train more engineers, modernize the grid, fund science, and deploy technology at the speed of the century we are already in.